Your cart is empty!
Chart Layout
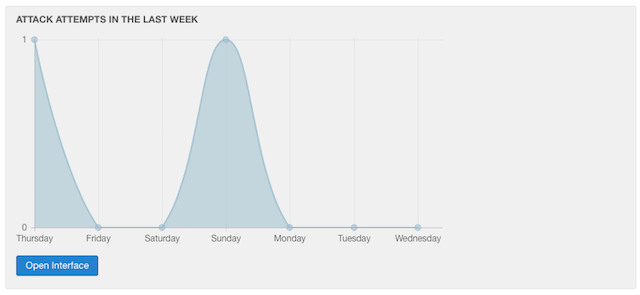
The Chart layout renders a graphic containing the latest reports registered by VikSecure. It simply replicates the main functionalities of the Dashboard view.
It is possible to change the time range that the module uses to render the chart from the Chart > Statistics Range parameter.
The module supports all the following time ranges:
- Last week
- Last 2 weeks
- Last month
- Last 2 months
- Last 3 months
The Open Interface button is a shortcut to access quickly the interface of the plugin.
Last Update: 2017-10-10 16:44
Helpful?